How to Reduce Logistics Costs Using Data
- Team Fluidata

- Mar 31
- 3 min read
Updated: Apr 2
TL;DR: Logistics firms lose 5 –15% of potential profit to invisible inefficiencies that spreadsheets cannot catch. In 2026, protecting margins is not about cutting harder - it is about seeing clearer. Here is how data does what renegotiated carrier rates never could.
Why Are Logistics Costs Still Rising Despite Rate Re-negotiations?
In 2026, cutting costs does not mean doing less. It means knowing more. Most supply chain directors have run the standard playbook - renegotiate carrier rates, consolidate lanes, trim the warehouse footprint. And still, margins keep shrinking. Because the real losses are not sitting cleanly on your P&L. They are hiding just beneath it: wrong-sized shipments, routes that made sense six months ago but silently bleed cost today, and customer contracts priced on averages when actual cost-to-serve varies wildly by SKU and location.
These inefficiencies are invisible to a spreadsheet but not invisible to data.
Map Costs Before You Cut Them
You cannot optimize what you cannot see. Most organizations are working with cost data that is already 30–90 days old by the time it reaches a report. By then, the decisions that created those costs are long made.
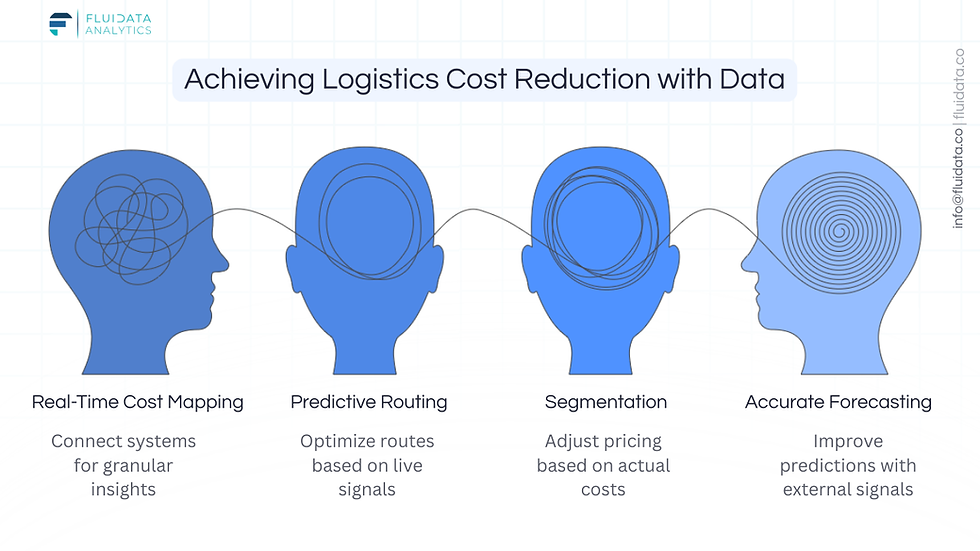
Connecting your TMS, WMS, ERP, and carrier APIs into a unified data layer gives you costs in real time - broken down by lane, shipment, customer, and facility. One mid-size 3PL discovered that 22% of their lanes were running at a structural loss, not because of bad contracts, but because volumes had shifted and nobody had remodelled the lanes since. A data problem, not a procurement problem.
Predictive Routing Pays for Itself
Static route planning, built once and updated quarterly, is one of the most expensive habits in logistics. Fuel prices, driver availability, and delivery windows shift constantly. A route that was efficient in January can quietly haemorrhage cost by April.
Predictive routing tools - now accessible to mid-market 3PLs, not just enterprise players -apply live signals to flag inefficiency before it becomes a cost line. Early adopters report 8–12% reductions in fuel and driver-hour spend. Not by running fewer routes. By running smarter ones.
Cost-to-Serve: The Number Most Teams Do Not Know
Reducing cost-to-serve is where data-driven supply chain savings get genuinely transformative. Within a single customer account, the cost of a rural delivery can be three to four times higher than an urban one. Without granular data, you are pricing contracts on fiction.
Segmenting customers by actual cost-to-serve - then adjusting surcharges, minimums, or service tiers accordingly - protects margin without touching a single carrier contract. It is the fastest lever most 3PLs are not pulling.
Forecasting: Where Inventory Costs Are Won or Lost
Every unnecessary expedited shipment is pure margin given away. Most firms know this, yet still forecast on 12-month rolling averages and gut feel. Modern forecasting tools pull in external signals - weather, local events, demand trends - to produce materially better predictions. Not perfect. Just better enough to stop paying for panic shipping.
Data Alone Will Not Do It
The 3PLs seeing sustained results are not just buying dashboards. They are building cultures where operations managers review lane-level cost variance daily, and pricing teams have live cost-to-serve data before quoting new contracts.
Technology surfaces the information. People have to act on it.
The firms still growing in 2027 will not have cut the deepest. They will have seen the clearest.
FAQs
What is cost-to-serve in logistics and why does it matter?
Cost-to-serve is the true, fully loaded cost of fulfilling an order for a specific customer or location. It matters because within a single account, a rural delivery can cost three to four times more than an urban one. Without this data, businesses are pricing contracts on averages and quietly losing margin on every outlier.
How do spreadsheets fall short in managing logistics costs?
Spreadsheets work with static, historical data, often 30 to 90 days old by the time it reaches a report. They cannot surface lane-level inefficiencies in real time, flag routes that have quietly become unprofitable, or segment customers by actual cost-to-serve.
Reach out to us at info@fluidata.co
Author: Team Fluidata
Fluidata Analytics


Comments